Our product recommendations were boring. I knew that because our customers told us. When surveyed, the #1 thing they wanted from us was better product discovery. And looking at the analytics data, I could see customers clicking through page after page of recommendations, looking for something new to buy. We weren't doing a good job surfacing the back half of our catalog. There was no serendipity.
One common way of increasing exposure to the long tail of products is by simply jittering the results at random. But injecting randomness has two issues: first, you need an awful lot of it to get products deep in the catalog to bubble up, and second, it breaks the framing of the recommendations and makes them less credible in the eyes of your customers.
What do I mean by 'framing'? Let's look at a famous example from Yahoo!
The Britney Spears Effect.
Let's say you're reading about this weekend's upcoming NFL game. Underneath that article are a bunch of additional articles, recommended for you by an algorithm. In the early 2000s, it turned out just about everyone wanted to read about Britney Spears, whether they would admit it or not.
So you get to the bottom of your Super Bowl game preview and it says "You might also like:" and then shows you an article about Britney and K-fed. You feel kind of insulted by the algorithm. Yahoo! thinks I want to read about Britney Spears??
But instead, what if said "Other people who read this article read:". Now...huh...ok - I'll click. The framing gives me permission to click. This stuff matters!
Just like a good catcher can frame a on-the-margin baseball pitch for an umpire, showing product recommendations on a website in the right context puts customers in the right mood to buy or click.
"Recommended for you" -- ugh. So the website thinks it knows me, eh? How about this instead:
"Households like yours frequently buy"
Now I have context. Now I understand. This isn't a retailer shoving products in front of my face, it's a helpful assemblage of products that customers just like me found useful. Chock-full of social proof!
Finding Some Plausible Serendipity
After an awesome brainstorming session with one of our investors, Paul Martino from Bullpen Capital, we came up with the idea of a trending products algorithm. We'll take all of the add-to-cart actions every day, and find products that are trending upwards. Sometimes, of course, this will just reflect the activities of our marketing department (promoting a product in an email, for instance, would cause it to trend), but with proper standardization it should also highlight newness, trending search terms, and other serendipitous reasons a product might be of interest. It's also easier for slower-moving products to make sudden gains in popularity so should get some of those long-tail products to the surface.
Implementing a Trending Products Engine
First, let's get our add-to-cart data. From our database, this is relatively simple; we track the creation time of every cart-product (we call it a 'shipment item') so we can just extract this using SQL. I've taken the last 20 days of cart data so we can see some trends (though really only a few days of data is needed to determine what's trending):
SELECT v.product_id
  , -(CURRENT_DATE - si.created_at::date) "age"
  , COUNT(si.id)
FROM product_variant v
INNER JOIN schedule_shipmentitem si ON si.variant_id = v.id
WHERE si.created_at >= (now() - INTERVAL '20 DAYS')
  AND si.created_at < CURRENT_DATE
GROUP BY 1, 2
I've simplified the above a bit (the production version has some subtleties around active products, paid customers, the circumstances in which the product was added, etc), but the shape of the resulting data is dead simple:
id  age count
14  -20 22
14  -19 158
14  -18 94
14  -17 52
14  -16 56
14  -15 56
14  -14 52
14  -13 100
14  -12 109
14  -11 151
14  -10 124
14  -9  123
14  -8  58
14  -7  64
14  -6  114
14  -5  93
14  -4  112
14  -3  87
14  -2  81
14  -1  19
15  -20 16
...
15  -1  30
16  -20 403
...
16  -1  842
Each row represents the number of cart adds for a particular product on a particular day in the past 20 days. I use 'age' as -20 (20 days ago) to -1 (yesterday) so that, when visualizing the data, it reads left-to-right, past-to-present, intuitively.
Here's sample data for 100 random products from our database. I'm anonymized both the product IDs and the cart-adds in such a way that, when standardized, the results are completely real, but the individual data points don't represent our actual business.
Basic Approach
Before we dive into the code, let's outline the basic approach by visualizing the data. All the code for each intermediate step, and the visualizations, is included and explained later.
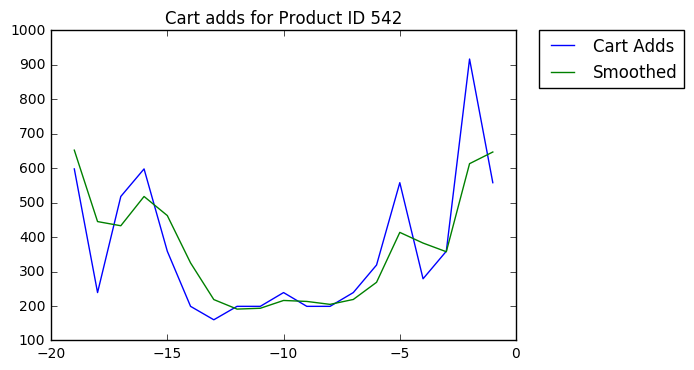
Here's the add-to-carts for product 542, from the sample dataset:

The first thing we'll do is add a low-pass filter (a smoothing function) so daily fluctuations are attentuated.

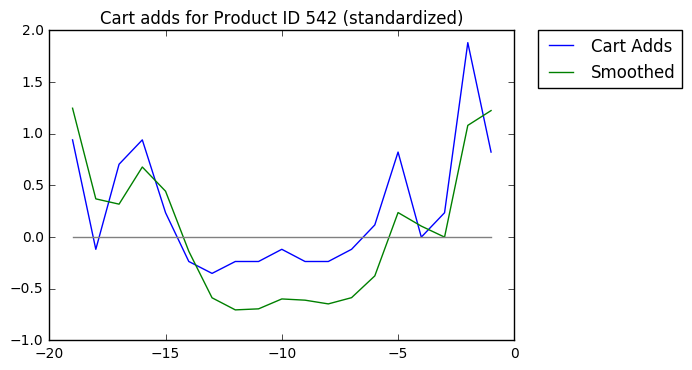
Then we'll standardize the Y-axis, so popular products are comparable with less popular products. Note the change in the Y-axis values.

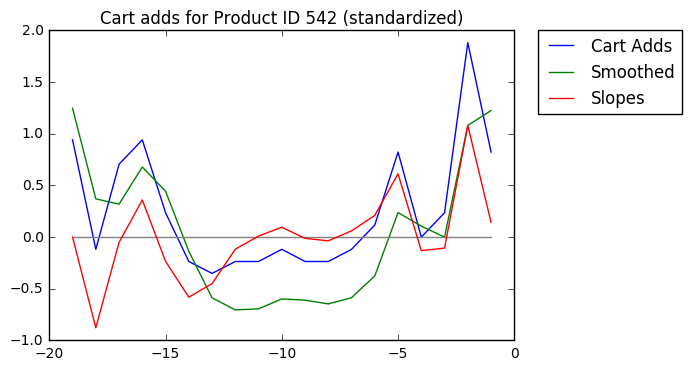
Last, we'll calculate the slopes of each line segment of the smoothed trend.

Our algorithm will perform these steps (in memory, of course, not visually) for each product in the dataset and then simply return the products with the greatest slope values in the past day, e.g. the max values of the red line at t=-1.
The Code
Let's get into it! You can run all of the code in this post via a Python 2 Jupyter notebook.
Here's the code to produce the first chart (simply visualizing the trend). Just like we built up the charts, we'll build from this code to create the final algorithm.
import matplotlib.pyplot as plt
import pandas as pd
import numpy as np

# Read the data into a Pandas dataframe
df = pd.read_csv('sample-cart-add-data.csv')

# Group by ID & Age
cart_adds = pd.pivot_table(df, values='count', index=['id', 'age'])

ID = 542
trend = np.array(cart_adds[ID])

x = np.arange(-len(trend),0)
plt.plot(x, trend, label="Cart Adds")
plt.legend(bbox_to_anchor=(1.05, 1), loc=2, borderaxespad=0.)
plt.title(str(ID))
plt.show()
It doesn't get much simpler. I use the pandas pivot_table function to create an index of both product IDs and the 'age' dimension, which just makes it easy to select the data I want later.
Smoothing
Let's write the smoothing function and add it to the chart:
1 2 3 4 5 6 7 8 9 10 11 12 13 14 15 16 17 18 19 | |
This function merits an explanation. First, it's taken more-or-less from the SciPy Cookbook, but modified to be...less weird.
The smooth function takes a 'window' of weights, defined in this
case by the
Hamming Window,
and 'moves' it across the original data, weighting adjacent data
points according to the window weights.
Numpy provides a bunch of windows (Hamming, Hanning, Blackman, etc.) and you can get a feel for them at the command line:
>>> print np.hamming(7)
[ 0.08  0.31  0.77  1.    0.77  0.31  0.08]
That 'window' will be moved over the data set ('convolved') to create a new, smoothed set of data. This is just a very simple low-pass filter.
Lines 5-7 invert and mirror the first few and last few data points in the original series so that the window can still 'fit', even at the edge data points. This might seem a little odd, since at the end of the day we are only going to care about the final data point to determine our trending products. You might think we'd prefer to use a smoothing function that only examines historical data. But because the interpolation just mirrors the trailing data as it approaches the forward edge, there's ultimately no net effect on the result.
Standardization
We need to compare products that average, for instnace, 10 cart-adds per day to products that average hundreds or thousands. To solve this problem, we standardize the data by dividing by the Interquartile Range (IQR):
def standardize(series):
    iqr = np.percentile(series, 75) - np.percentile(series, 25)
    return (series - np.median(series)) / iqr

smoothed_std = standardize(smoothed)
plt.plot(x, smoothed_std)
I also subtract the median so that the series more-or-less centers around 0, rather than 1. Note that this is standardization not normalization, the difference being that normalization strictly bounds the value in the series between a known range (typically 0 and 1), whereas standardization just puts everything onto the same scale.
There are plenty of ways of standardizing data; this one is plenty robust and easy to implement.
Slopes
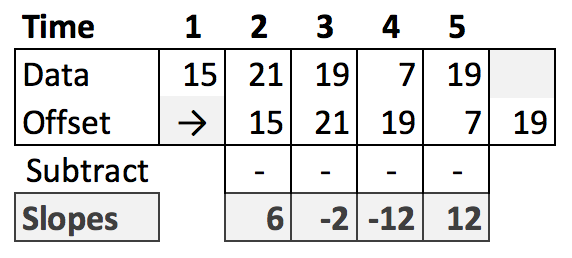
Really simple! To find the slope of the smoothed, standardized series at every point, just take a copy of the series, offset it by 1, and subtract. Visually, for some example data:

And in code:
slopes = smoothed_std[1:]-smoothed_std[:-1])
plt.plot(x, slopes)
Boom! That was easy.
Putting it all together
Now we just need to repeat all of that, for every product, and find the products with the max slope value at the most recent time step.
The final implementation is below:
import pandas as pd
import numpy as np
import operator

SMOOTHING_WINDOW_FUNCTION = np.hamming
SMOOTHING_WINDOW_SIZE = 7

def train():
    df = pd.read_csv('sample-cart-add-data.csv')
    df.sort_values(by=['id', 'age'], inplace=True)
    trends = pd.pivot_table(df, values='count', index=['id', 'age'])

    trend_snap = {}

    for i in np.unique(df['id']):
        trend = np.array(trends[i])
        smoothed = smooth(trend, SMOOTHING_WINDOW_SIZE, SMOOTHING_WINDOW_FUNCTION)
        nsmoothed = standardize(smoothed)
        slopes = nsmoothed[1:] - nsmoothed[:-1]
        # I blend in the previous slope as well, to stabalize things a bit and
        # give a boost to things that have been trending for more than 1 day
        if len(slopes) > 1:
            trend_snap[i] = slopes[-1] + slopes[-2] * 0.5
    return sorted(trend_snap.items(), key=operator.itemgetter(1), reverse=True)

def smooth(series, window_size, window):
    ext = np.r_[2 * series[0] - series[window_size-1::-1],
                series,
                2 * series[-1] - series[-1:-window_size:-1]]
    weights = window(window_size)
    smoothed = np.convolve(weights / weights.sum(), ext, mode='same')
    return smoothed[window_size:-window_size+1]


def standardize(series):
    iqr = np.percentile(series, 75) - np.percentile(series, 25)
    return (series - np.median(series)) / iqr


trending = train()
print "Top 5 trending products:"
for i, s in trending[:5]:
    print "Product %s (score: %2.2f)" % (i, s)
And the result:
Top 5 trending products:
Product 103 (score: 1.31)
Product 573 (score: 1.25)
Product 442 (score: 1.01)
Product 753 (score: 0.78)
Product 738 (score: 0.66)
That's the core of the algorithm. It's now in production, performing well against our existing algorithms. We have a few additional pieces we're putting in place to goose the performance further:
-
Throwing away any results from wildly unpopular products. Otherwise, products that fluctuate around 1-5 cart-adds per day too easily appear in the results just by jumping to 10+ adds for one day.
-
Weighting products so that a product that jumps from an average of 500 adds/day to 600 adds/day has a chance to trend alongside a product that jumped from 20 to 40.
There is weirdly little material out there about trending algorithms - and it's entirely possible (likely, even) that others have more sophisticated techniques that yield better results.
But for Grove, this hits all the marks: explicable, serendipitous, and gets more clicks than anything other product feed we've put in front of our customers.